neuroscience-ai-reading-course
Toward EEG Sensing of Imagined Speech
Original Publication
D’Zmura M., Deng S., Lappas T., Thorpe S., Srinivasan R. (2009) Toward EEG Sensing of Imagined Speech. In: Jacko J.A. (eds) Human-Computer Interaction. New Trends. HCI 2009. Lecture Notes in Computer Science, vol 5610. Springer, Berlin, Heidelberg
Experimental Setup
- Four subjects participated in an experiment with six conditions (Fig 1), these conditions were a combination of 2 syllables in three rhythms.
- Syllables “ba” and “ku” were chosen as they did not have any meaning associated with them.
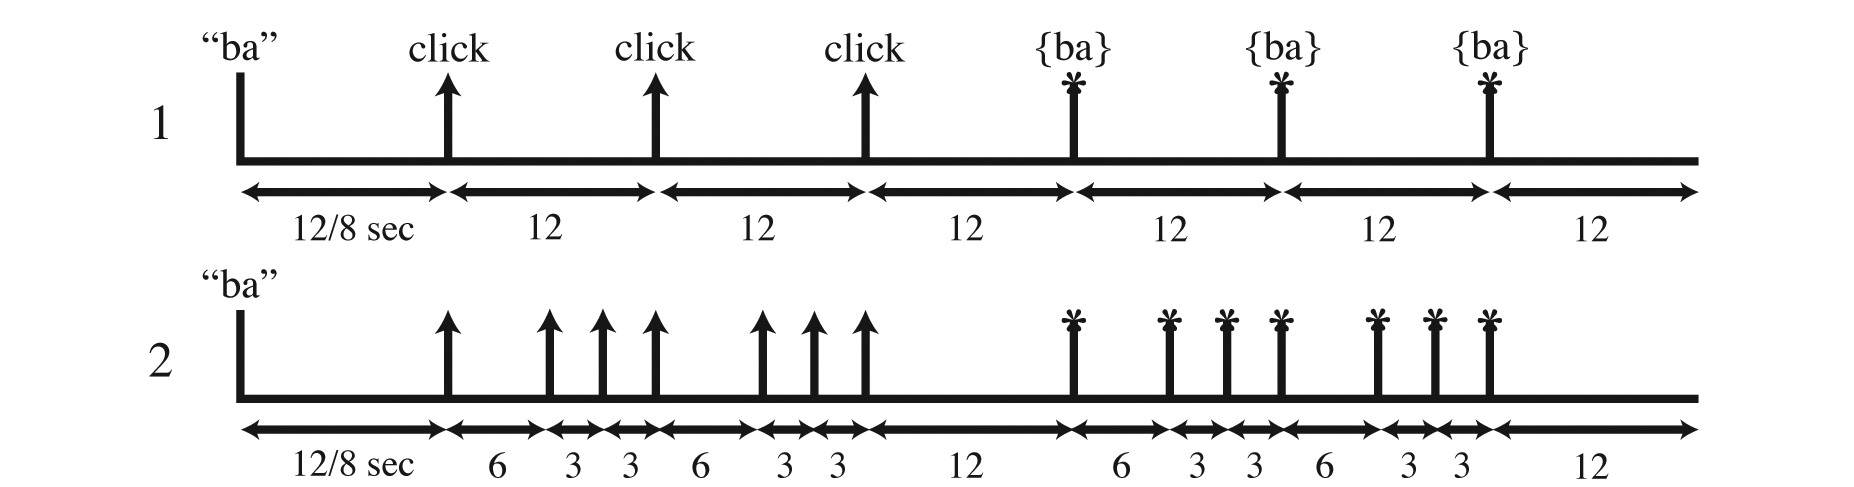
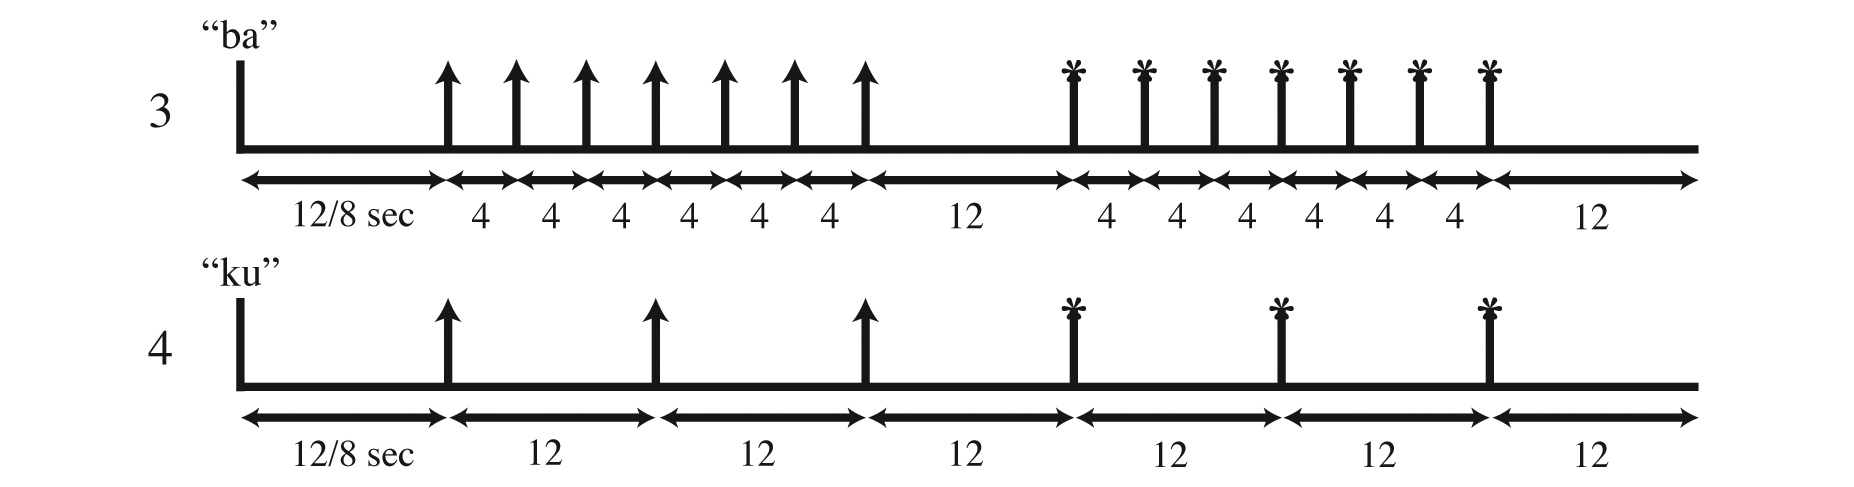
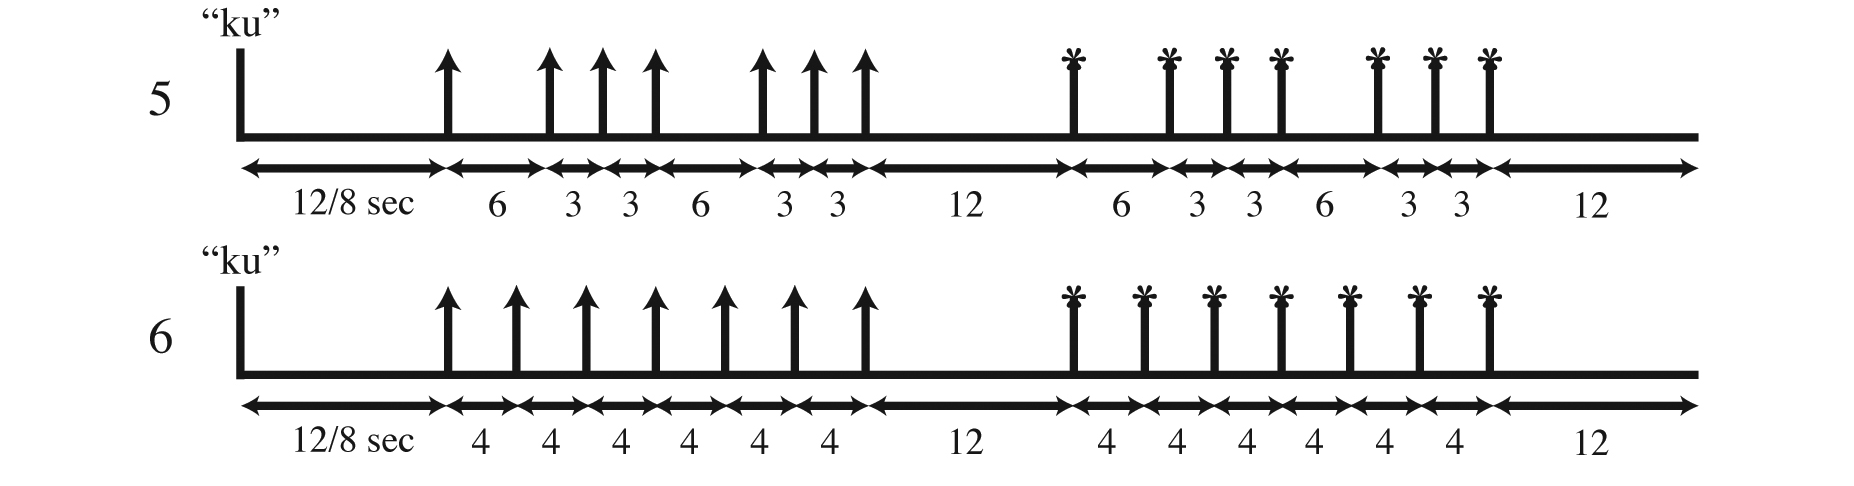
Fig. 1 Timelines for the 6 conditions. Time durations are in eighths of a second.
- The condition for each trial was cued during an initial period of duration 4.5 sec (12/8 sec = 1.5 sec; 3 x 1.5 sec = 4.5 sec). During this initial period, subjects heard through Stax electrostatic earphones either a spoken “ba” or a spoken “ku” followed by a train of clicks (arrows) indicating the rhythm to be reproduced. Desired imagined syllable onset times reproduce the cued rhythm and are indicated by asterisks.
- Each experimental session comprised of 20 trials for each of the six conditions(block-randomized order).
- Each subject participated in six such sessions for a total of 120 trials per condition.
- So a total of 720 trials for each subject.
- EEG signals were recorded using a 128 Channel Sensor Net (Electrical Geodesics) in combination with an amplifier and acquisition software (Advanced Neuro Technology).
- The EEG was sampled at a frequency of 1024 Hz.
- Subjects were instructed to keep their eyes open in the dimly-lit recording room and to avoid eye and other movements during the six seconds, following the cue, during which speech was imagined without any vocalization whatsoever.
Preprocessing
- EEG data is segmented to provide time-varying waveforms for each condition, electrode, and trial.
- Data from 18 electrodes that are sensitive to electromyographic artifacts are removed. Electrodes near the lowest position of head, eyes, temples, etc..
- Remove mean and linear trend from each waveform.
- Low-pass filter to remove the 60 Hz line noise.
- Decide a threshold above which signals are likely to be contaminated with electromyographic artifacts and remove them.
Methodology
- Alpha-, beta- and theta-band activity were computed for each electrode using band-pass elliptic filters.
- These band-pass filtered waveforms were Hilbert-transformed to provide envelopes.
- These envelopes serve both as inputs to the matched filters while testing and as data for the construction of matched-filters for training purposes.
- An electrode’s average envelope is found by averaging across the trials for each of the six conditions.
- These six envelopes are then pseudo-inverted to provide the six filters for each electrode.
- The inner product of each filter will return a positive value for the corresponding condition’s average envelope and a zero for other envelopes.
- Information is gathered and the sum of inner-products for each condition across all the electrodes is compared. The condition with the maximum sum is predicted.
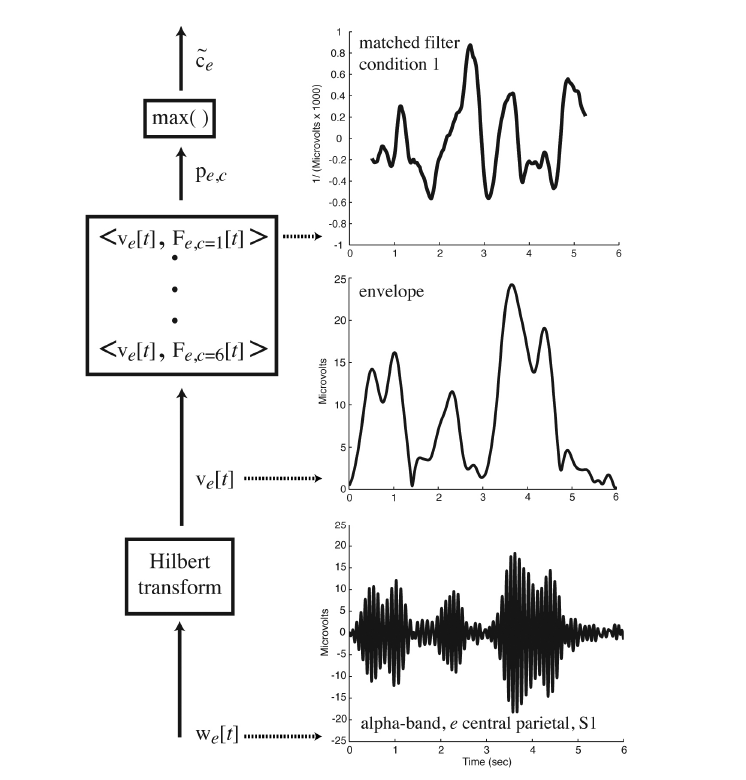
Fig. 2. Preprocessed and band-pass-filtered waveform we[t], recorded by electrode e, is Hilbert-transformed to provide envelope ve[t]. The inner product <, > of this envelope with each matched filter Fe,c[t], one filter per condition per electrode, provides six numbers pe,c. These six numbers measure how well the particular trial’s envelope matches the filter for each condition. The maximum of these six numbers is used to determine the most likely condition c˜e.
Results
- The distributions of classification performance across the scalp are similar across the four subjects. The most informative electrodes lie largely near the top of the head (vertex) where electromyographic artifacts have their least influence.
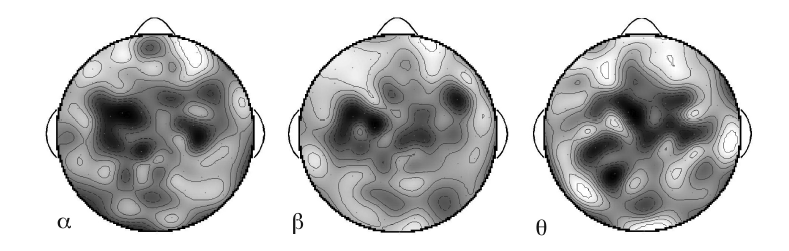
Fig. 3. Distributions of classification performance across the scalp for alpha (α), beta (β) and theta (θ) bands for subject S4. Darker values indicate the positions of electrodes providing better classification performance.
- Beta band (13-18Hz) is, for all but one subject, the most informative frequency band; theta (3-8Hz) and alpha (8-13Hz) are comparable for all subjects but S1.
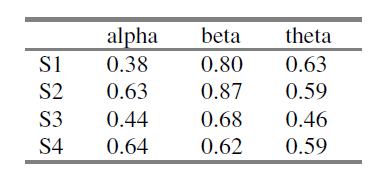
Fig. 4 Classification performance using matched filters for envelopes in three frequency bands. The fraction of correctly-classified trials (720 trials per subject, identified in the left column) is indicated. The chance performance level in this classification among six conditions is 1/6 (0.17).
- Per-condition classification performance for all the three frequencies:
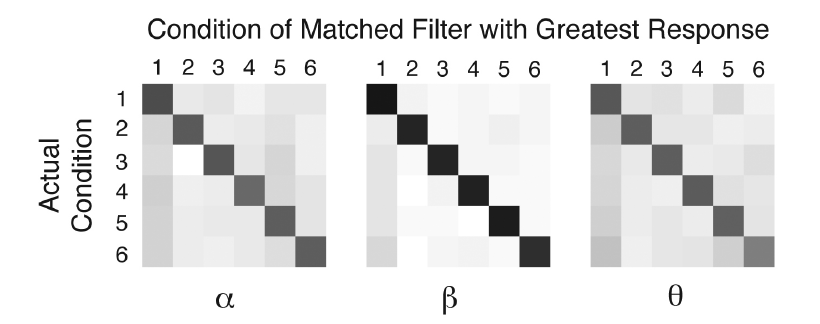
Fig. 5 Classification matrices for subject S2. Values along the diagonals indicate correct classification, while non-white values off the diagonal indicate errors. The black gray-value in the middle panel (beta-band) for actual condition 1 and matched filter condition 1 (top left square) represents 91% of the trials; lighter shades indicate smaller values (through white indicating 0%). Perfect performance would be indicated by all off-diagonal entries set to white.